ISS ESG | BIODIVERSITY SOLUTIONS
BIODIVERSITY IMPACT ASSESSMENT TOOL
Assess your portfolio’s impact on biodiversity
Global biodiversity loss can lead to operational, legislative, and reputational risks for investors, but many lack the information needed to conduct a holistic risk assessment.
ISS ESG’s Biodiversity Impact Assessment Tool enables investors to assess the impact of companies’ business and supply chain activities on biodiversity.

DID YOU KNOW THAT?
Based on OECD’s Environmental Outlook to 2050, without new policies in place, we can expect a 10% reduction in total global terrestrial biodiversity. This includes one-third of all marine mammals, 40% of all amphibian species, and nearly 33% of coral reefs.
SOURCE: OECD 2022
BENEFITS OF USING THE BIODIVERSITY IMPACT ASSESSMENT TOOL
The Biodiversity Impact Assessment Tool can be used to support compliance with climate-related disclosure frameworks within the European Union, including Article 29 of the French Energy Transition Law, as well as the UN Convention on Biological Diversity and the Task Force on Nature-related Financial Disclosures.
COVERAGE
Approximately
17,000+
Issuers
Data as of January 2024. All figures are approximate.
Source: ISS ESG
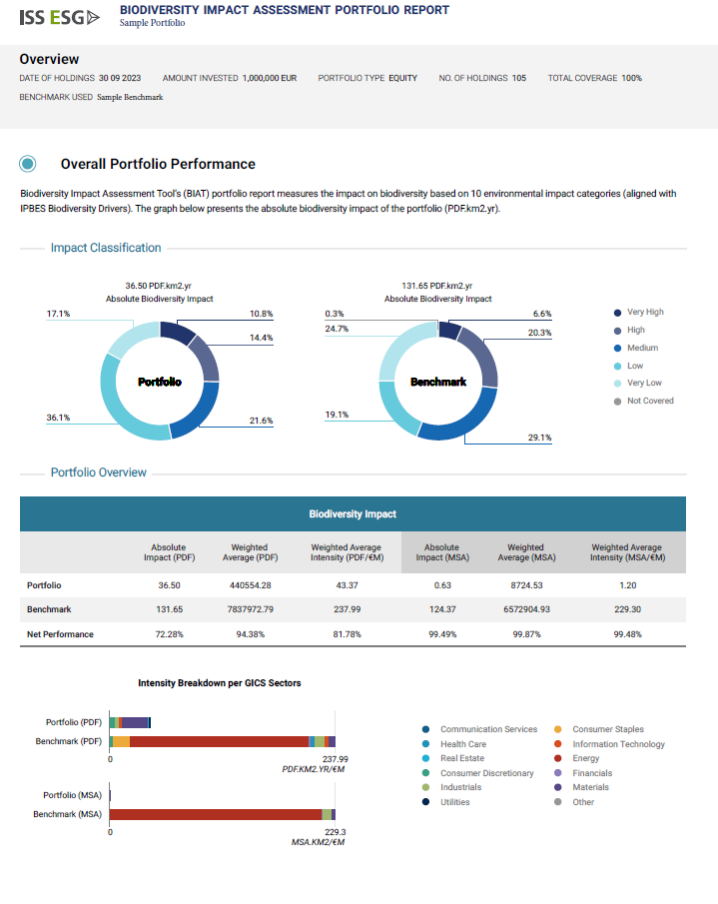
With the Biodiversity Portfolio Report investors can:
- Compare their portfolio’s Biodiversity Impact to a benchmark
- View the breakdown of impact per sector, country, and biodiversity drivers
- Examine the biodiversity impact attribution to sector allocation versus
issuer selection - See the top and bottom (5) five holdings in their portfolios
- Observe Economic Activities with the largest impact
- Assess for Dependencies on Ecosystem Services (including Materiality Classification)
BIODIVERSITY IMPACT PER REGION
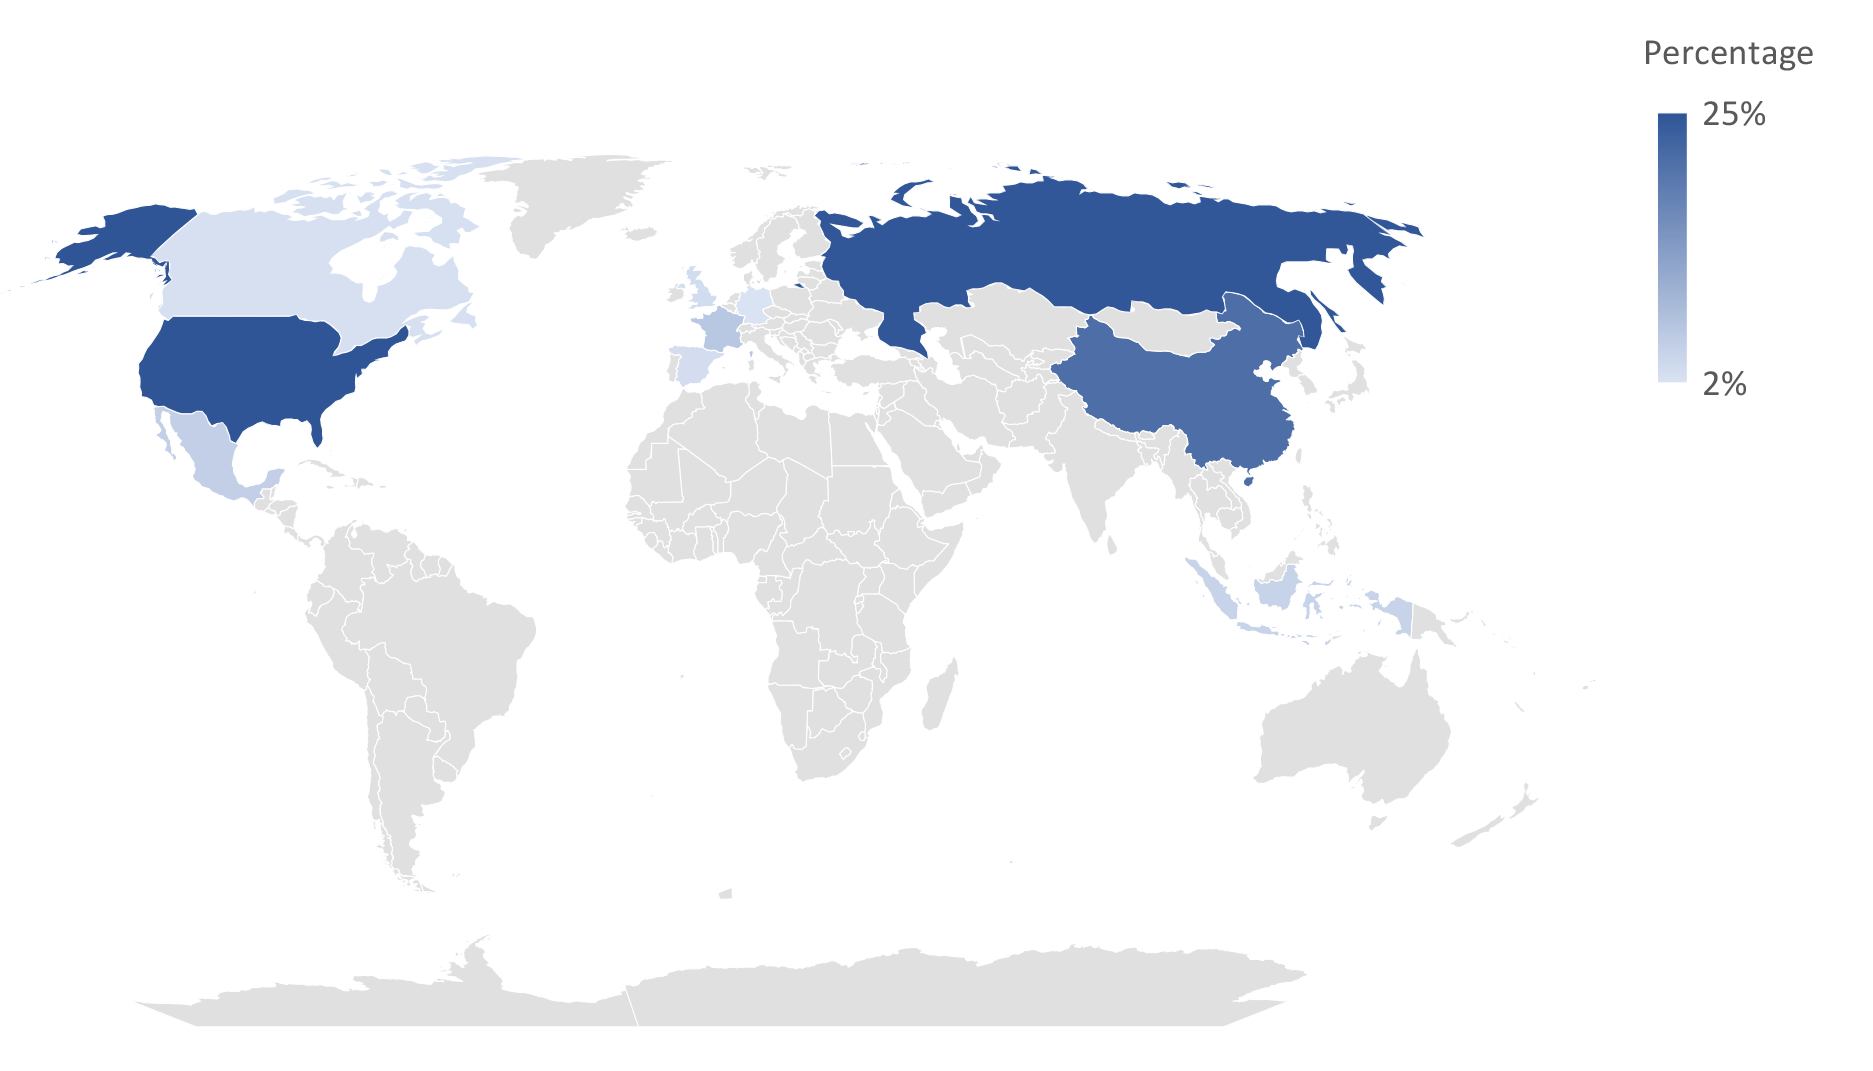
Example: Company in the “Food Products” industry
TOP THREE MOST SEVERE RISKS
BIODIVERSITY
LOSS
CLIMATE ACTION
FAILURE
EXTREME
WEATHER
According to the World Economic Forum’s 2022 Global Risk Report, biodiversity loss ranks alongside climate action failure and extreme weather as one of the top three most severe risks facing the world during the next decade.
SOURCE: https://www3.weforum.org/docs/WEF_The_Global_Risks_Report_2022.pdf
Distinct Methodology for Assessing Companies’ Biodiversity Impact

Economic Activity Identification &
Supply Chain Modeling

Supply Chain Impact
Assessment

Species Richness
Assessment

Species Abundance
Assessment

Refinement and
Normalization


