As of mid-April, 60 percent of the S&P 500 have reported fiscal 2014 pay figures, and about half of all Russell 3000 companies have filed. Several notable trends in 2014 executive pay are emerging.
Overall Pay Rises Significantly
Across the Russell 3000, and limited to companies that had the same CEO for both fiscal 2013 and 2014, the median chief executive raise for 2014 was 12.6 percent. That’s up significantly from last year’s increase.
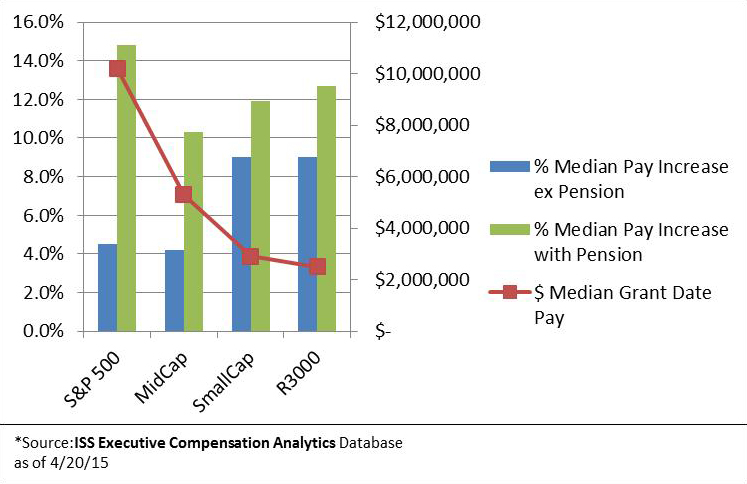
ISS’ Executive Compensation Analytics database (ECA) shows that, in 2014, the median S&P 500 CEO received $12.1 million in grant-date pay (a 14.8 percent median increase). The median MidCap S&P 400 CEO was awarded more than $5.9 million (a 10.3 percent median increase), while the median SmallCap S&P 600 CEO received $3.0 million (an 11.9 percent median increase), and the median CEO of smaller Russell 3000 companies received $2.6 million (a 12.7 percent median increase).
Increased Focus on Pension
The figures listed above, and reflected in the graph below, all include pension payments; the “change in pension” item is proving to be one of the headline issues affecting compensation analysis in the U.S. this year. With low interest rates andthe Society of Actuaries tacking on years of additional executive life expectancy, supplemental executive retirement plan (SERP) adjustments have already reached record highs. Some exemplars include Prudential, ITC Holdings, Huntington Ingalls, and Tiffany, all companies where pension changes exceeded the remainder of the CEO’s pay.

Not including the “change in pension” item, the median CEO raise is 7.2 percent – about one percentage point lower than last year.
For the 1,261 companies in this analysis of ECA data, the total aggregate change in pension for fiscal 2013 was $210 million; for the same companies in fiscal 2014, the total was $743 million. That’s an increase of more than 350 percent.
Regional Pay and Trends
Looking at ECA data, CEOs in the United States have done well compared with their foreign colleagues. Among the U.K.’s FTSE 250 companies that have disclosed so far, the median increase was 4.6 percent in 2014; in Canada the median increase was 3.4 percent. While Australian CEOs saw bigger raises than their U.K. and Canadian counterparts, with a median increase of 9.8 percent, they did not see U.S. levels.

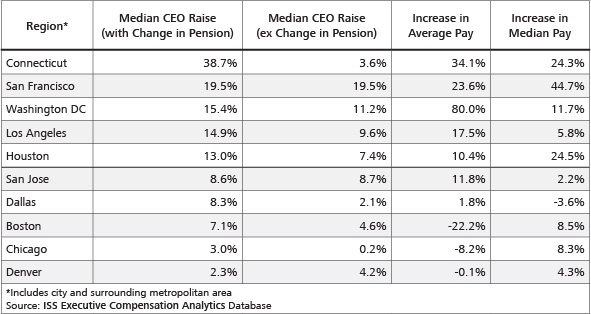
Another ECA query, limited to Metropolitan Statistical Areas that had at least 20 companies disclosing compensation as of the beginning of this week, showed substantial regional differences in CEO pay.
Some trends that we’ve seen over previous years are continuing to play out – trends in stock option usage, discretionary bonuses, and equity compensation in particular. Fewer companies – 4.4 percent fewer – are awarding stock options to their CEOs in 2014, compared to 2013, and 1.8 percent fewer companies are paying purely discretionary cash bonuses to their CEOs. On the other hand, equity compensation is up again in 2014, with 85 percent of the increases in 2014 (excluding the change in pension increases) coming in the form of increased equity grants.
Determining Performance Pay and the CD&A
For the S&P 500 and S&P 400 firms, performance equity is reaching an equilibrium, and attention is shifting from simply including performance equity to focusing on how performance equity gets paid out. Specifically, larger companies are hearing from investors much more frequently about their choice of performance metrics, and how their associated goals are calibrated. Investors can see vestiges of that right in the CD&A, with many more companies giving a detailed explanation of the process for selecting metrics and calibrating goals.
In fact, the CD&A has probably undergone the greatest evolution of any facet related to compensation in the U.S. this year, with increased and improved disclosure around shareholder engagement, the rationale for compensation decisions, and transparency around performance-based pay. The increased disclosure is intended to woo shareholders, and their votes, but also serves as valuable insight into the thought process of the compensation committee in determining executive pay structures.
As of April 23, a quick search in ISS’ Voting Analytics shows that only four Russell 3000 companies have failed their say-on-pay votes thus far. At Biglari Holding‘s (ISS Quickscore: 5, Compensation Pillar: 9) April 9 proxy contest, exactly 50 percent of shareholders voted to support the company’s pay plan, not the majority of votes cast needed for approval. And, at the April 16 meeting of Cogent Communications (ISS QuickScore: 9, Compensation Pillar: 10), only 41 percent of the votes were cast in favor. However, at the other two meetings where say-on-pay proposals failed –Nuance Communications(ISS QuickScore: 10, Compensation Pillar: 10) and Schnitzer Steel Industries (ISS QuickScore:9, Compensation Pillar: 8) – the level of investor dissent was striking. Schnizter’s proposal received support from only 24.4 percent of votes cast, and Nuance’s received just 14.6 percent support, while Voting Analytics data has average support in the Russell 3000 so far this year at just under 91 percent. In both cases, ISS identified a pay-for-performance disconnect characterized by high CEO pay compared with peers while shareholder returns significantly underperformed peers over the short and long term.
Canada
While the U.S. is seeing retention grants to NEOs other than the CEO, Canada may be seeing a trend of post-retirement awards to CEOs.
The most significant case identified to date is the Canadian Imperial Bank of Commerce (CIBC); in connection with a change in leadership, the bank signed a two-year agreement with the outgoing CEO, Gerry McCaughey, to ensure a smooth transition. Four and a half months in, the bank terminated the agreement, resulting in a cash payout of $17 million, a significant portion of which included the accelerated vesting of long-term incentive awards.
Shareholders appear to consider this payment a significant concern; on April 23, the company failed its say-on-pay vote with 56.9 percent of shareholders voting against the resolution. This marks the lowest support level and first failed MSOP in the 2015 Canadian season
Although CIBC is the most startling example, similar cases have been seen on a smaller scale, with payments generally based on a multiple of two times base salary and average bonus, issued upon a CEO’s retirement. This is often in addition to a sizable pension.
Also following the US, the use of performance-based equity also appears to be to be on the rise amongst Canadian issuers.
Performance-based stock options remain a relatively rare compensation instrument in Canada, with only nine companies granting them, an ISS analysis finds. Among these for the first time, however, is Magna International, which, in 2014, adopted performance-based stock options that vest only if TSR is above the 60th percentile of a peer group.
However, there is a trend toward performance-based stock awards, commonly referred to as PSUs. The number of companies that have adopted performance-based equity has been steadily increasing, at a rate of about 7 to 8 percent a year in the TSX Composite Index. These awards have now been granted at 61 percent of Composite Index companies and 82 percent of TSX 60 companies.
Going Forward
This is just a snapshot of compensation trends in two major markets in North America. For more compensation details in these and all the global markets that ISS covers, your Account Executive or Client Services Manager can assist you in a demo of Executive Compensation Analytics. Also, keep an eye out for further updates as proxy season progresses around the globe, as well as our market-by-market post season reports this summer, which will include detailed information on compensation trends and vote results. –John Roe, Head of Executive Compensation Analytics; David Kokell, Head of U.S. Compensation Research; Harlan Tufford, Canadian Research


