Evaluating Peer Groups Using Network Connection Strength
Milton Rock, former Hay Group managing partner and arguably the creator of the executive compensation peer group, likely could not have imagined the extent to which this concept would evolve. Today, peer groups are the subject of constant debate, with investors casting a critical eye upon peer selection methodologies and developing increasingly sophisticated analytics to evaluate corporate peer groups; meanwhile, issuers are working harder than ever to find the right combination of comparators and to articulate the thoughtfulness behind their process. Nevertheless, questions remain: how effective are companies at building appropriate compensation peer groups? And what might investors be looking for to sound the alarm bells?
To answer these questions, ISS’ Compensation Products team developed a quantitative scoring model to evaluate a company’s selected peers based on their relative size and the strength of the peer network – how often companies are selecting each other and their closely-related peers.
Generally speaking, companies do a good job choosing peers. On average, more than 70 percent of peer groups in the S&P 500 consist of peers that fall within the optimum size range and have high connection strengths. The remaining roughly 30 percent of peers are either poorly connected to the subject company (the “target”) and its network, or are too small or too large relative to the target.
The Methodology: Classifying Peers Using Relative Size and the “Wisdom of the Crowd”
To classify peers into peer-fit categories, we formulated a scoring model that leverages all peer groups captured in ISS’ database of publicly-traded U.S. companies. The scoring model measures two key metrics: relative company size, and network connection strength. Relative company size is straightforward, using the ratio of the target’s size (as defined in ISS’ peer group construction methodology; generally revenue, with carve-outs for assets among some financial institutions and market capitalization for some oil & gas companies) to the size of each peer.
Connection strength is more difficult to construct, and requires a complete database of companies that every company publishing a peer group has selected. Our scoring model rates the strength of network connections by examining the interconnections among companies – which peers are selected by the target, which companies are selecting the target as a peer, which other companies they may be both selecting in common, and how often those connections occur. The connection strength is determined by how many degrees of separation exist between the target and a network peer as well as the direction of that relationship: for instance, is the target selecting the peer, is the peer selecting the target, or are both companies selecting each other? Additionally, we apply weightings for size and industry to give a greater rank to companies that fall within an appropriate size range and relevant industry. From this peer connection data, we build a prioritized list of companies that are closest aligned to the target based on connections to other companies – the “wisdom of the crowd,” as it relies on the judgment of many boards and their peer selections to develop a perspective on any one company.
Each company’s actual proxy-disclosed peer group is compared to its prioritized “wisdom of the crowd” peer network, as well as its relative size criteria to categorize each company peer choice into one of six categories. Those categories are arranged like this:
|
Connection Strength |
||||
|
Low |
High |
|||
|
Size |
Small |
Bad Fit |
Peers of Necessity |
|
|
Comparable |
New Wisdom |
Conventional Wisdom |
||
|
Large |
Bad Fit |
Aspirational |
||
To explain the meanings in names chosen for these peer classifications, we present the list below, sorted from best fit to worst:
| Peer Classification | Description |
|---|---|
| Conventional Wisdom Peers | Good fit in terms of size, industry, and network relationships |
| New Wisdom Peers | Poor network relationships, but with optimal size range, potentially chosen based on key judgment by the board around operational similarities |
| Peers of Necessity | Typically chosen out of necessity due to a lack of similar peers in the optimal size range |
| Aspirational Peers | Too large in terms of size, but in similar or adjacent industries |
| Bad Fit Peers (Too Small) | Poor network relationships and below optimal size range |
| Bad Fit Peers (Too Large) | Poor network relationships and above optimal size range |
Methodology in Action: In Aggregate, S&P 500 Peer Groups Fare Well in the Analysis
When we apply the methodology to the self-selected peer groups disclosed by S&P 500 companies, we find that, in aggregate, companies are doing a good job of selecting peers. Almost three-quarters of peers are in the “Conventional Wisdom” category – meaning that these peers are within size and network strength constraints that indicate the companies are (outside-in) making good peer choices.
|
Connection Strength |
||||
|
Low |
High |
|||
|
Size |
Small |
2.5% |
9.9% |
|
|
Comparable |
3.1% |
72.8% |
||
|
Large |
5.2% |
6.5% |
||
However, given that the average peer group contains 15 companies, the average company has roughly four sub-optimal peers that may warrant further analysis and review. Comparing the “Peers of Necessity” (9.9 percent) to the aspirational peers (6.5 percent), we find that S&P 500 companies – perhaps as expected – more often chose industry-aligned peers smaller than themselves, possibly out of necessity. They may simply be running out of comparable companies with comparable size.
However, Not All Peer Groups Are Created Equal
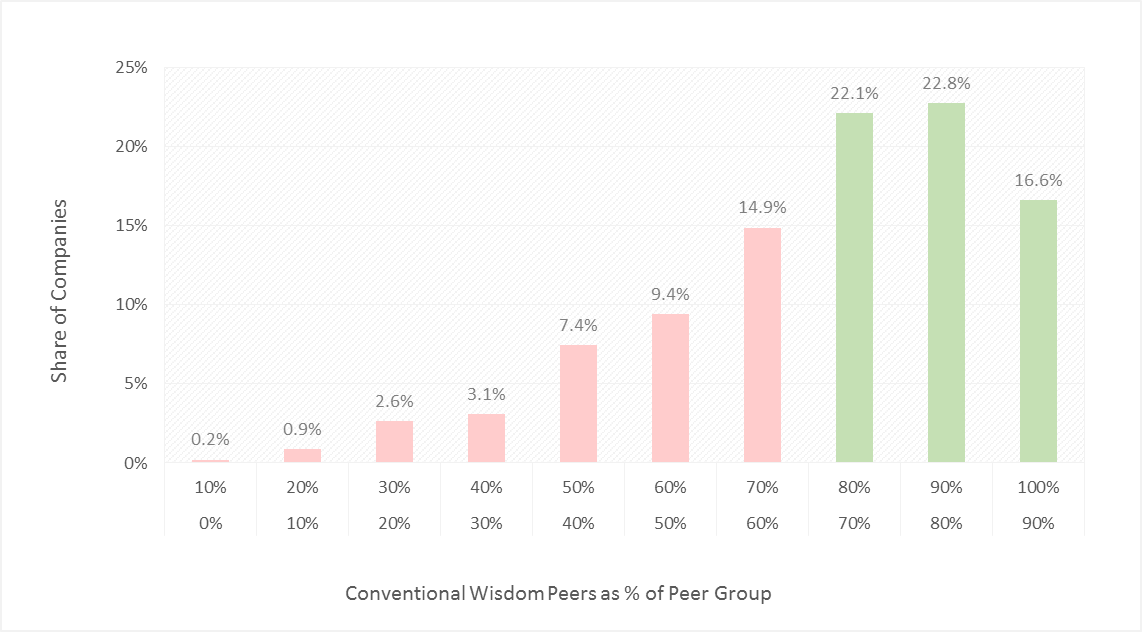
While a significant share of companies on average choose optimal peers, a more detailed look suggests that many proxy-disclosed peer groups have room for improvement. Within the S&P 500, nearly 40 percent of companies have peer groups comprised of less than 70 percent of peer companies that are within the optimum size range and have high connection strengths – conventional wisdom peers.
Distribution of S&P 500 Companies by Share of “Conventional Wisdom” Peers

Looking at the left side of the chart, where companies have less than 70 percent conventional wisdom peer composition, issues in peer selection are amplified where we see smaller companies choosing aspirational peers and larger companies choosing peers of necessity. Next, we’ll explore what these two classifications represent under this framework.
Large and Small Companies Choose Peers Similarly
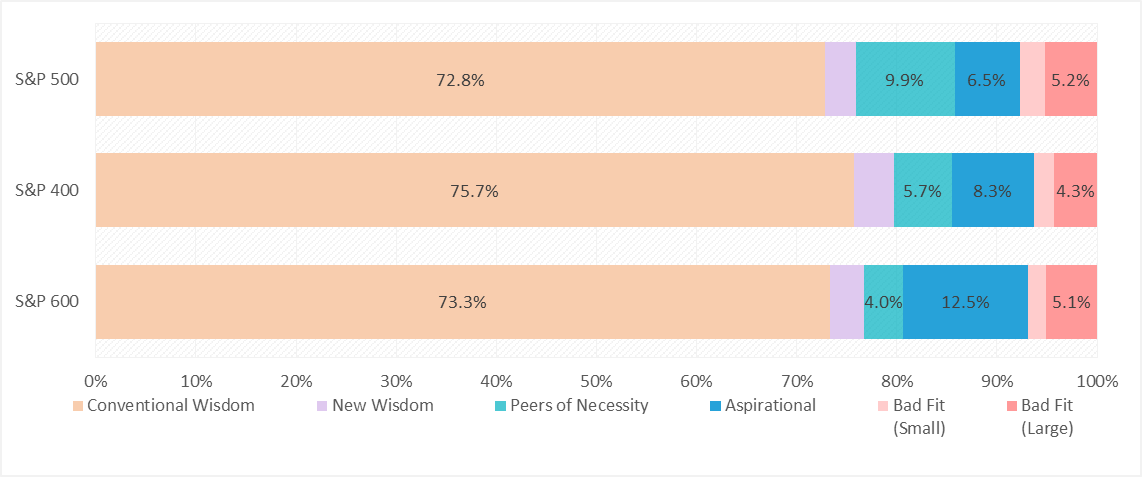
We extended our analysis to review mid- and small-cap companies. And while we expected to see larger variations in peer composition and particularly within the optimum range, we were surprised to find peer composition in S&P 400 and S&P 600 indices to be similar to the S&P 500. Nevertheless, there are some notable differences:
Distribution of S&P 500 Companies by Share of “Conventional Wisdom” Peers

Larger companies are more likely to choose “peers of necessity” that seem appropriate in terms of network but are small in size relative to the target. In these cases, relevant business operations or market adjacencies likely outweigh size concerns and larger companies are more likely to have difficulty finding companies at or above their own size.
On the other hand, smaller companies are more likely than the other index groups to choose “aspirational peers” that seem appropriate in terms of network but are too large in size relative to the subject company (i.e., greater than 2.5 times the size of the subject company). While it may be difficult to find peers of similar size, choosing aspirational peers creates the risk of benchmarking pay against larger/higher-paying companies; in turn, this could create an inappropriate benchmark when determining executive pay, as compensation is typically targeted at the median of the chosen peer group.
Peer companies chosen outside the optimal size range are often far larger than the target. Of the segment of peer companies in the S&P 500 that exceed the 2.5 size multiple of the target, the median size is 3.3 times that of the subject company.
Some Sectors are Better Than Others
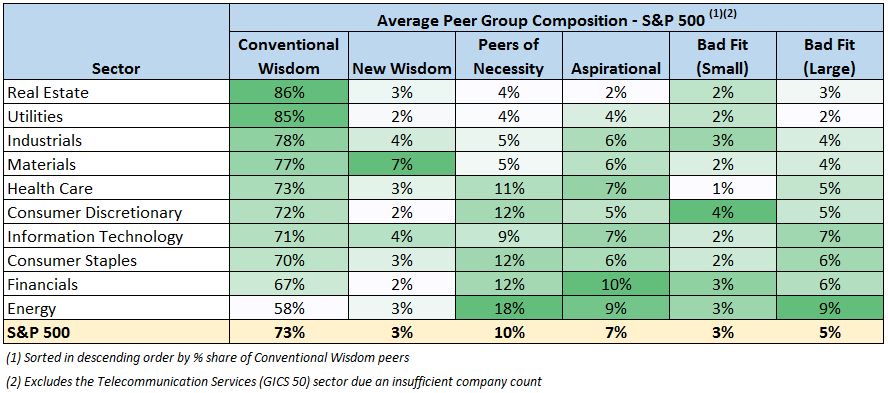
Conducting the same analysis by sector for S&P 500 companies, we observe notable diversity amongst companies in various sectors:
- At 58 percent, the energy sector has the lowest average share of conventional wisdom peers, compared to 73 percent for the full S&P 500.
- The utilities and real estate sectors have the highest average share of conventional wisdom peers at 85 percent and 86 percent, respectively.
The energy and financials sectors have the highest use of aspirational peers that are appropriate in terms of network connections, but are too large relative to the subject company (i.e., greater than 2.5 times the size of the subject company by revenue or assets).

The Peer Group Imperative
In summary, companies’ peer groups are, on average, fairly well-constructed. Companies are generally focusing on peers that are of similar size and industry and which rank highly in their peers’ networks. However, peer groups contain, on average, four sub-optimal comparators that could benefit from additional analysis and consideration for potential replacement.
Peer group construction and evaluation is an ongoing and ever-changing process as companies expand, merge, or go through different business cycles, and as the external perceptions of investors and stakeholders evolve over time. There will always be qualitative elements to the peer evaluation process, but by leveraging the wisdom of the crowd provided through peer group disclosures and combining best practices in peer selection, it is possible to improve the process and identify better peers.


